For nearly a decade, the Quality Deer Management Association (QDMA) has compiled and disseminated some of North America’s finest research on whitetail deer. This year’s Whitetail Report lays a finger squarely on the pulse of America’s deer hunters and provides a long-term look at what’s truly happening in the world of whitetails. Here are a few important figures from the 2019 QDMA Whitetail Report.
Harvest Trends
Overall, harvest trends provide some perspective on deer populations and the people who hunt and manage them. The most recent data available, from 2017-18, is divided into three U.S. regions: Southeast, Northeast and Midwest, and Canada.
Let’s start with antlered bucks killed because they get most of the attention. The top five states are:
Texas (506,809)
Michigan (226,656)
Pennsylvania (163,750)
Wisconsin (158,812)
Georgia (139,424).
“Not fair,” you say? “Texas is a much larger state.” It turns out you’re right. The top five states for antlered bucks harvested per square mile are:
Michigan (4.0)
Pennsylvania (3.7)
Maryland (3.3)
South Carolina (3.1)
Wisconsin (2.9)
These figures are pretty similar to those of the last ten years give or take a state or two.
While nationwide deer herds seem to show a slight trend toward leveling out, that’s not the case in some areas, particularly the Northeast. After Texas (up 54 percent), the four states with the greatest increase in buck harvest in 2017, compared to the five-year average, were:
Connecticut (+27%)
Delaware (+24%)
Massachusetts (+23%)
Pennsylvania (+21%)
Age Structure
The proportion of yearling bucks in the harvest is a good index as protecting them to improve age structure is one of the cornerstones of QDMA. It also helps increase the proportion of older bucks sporting bigger racks.
As a nationwide average, yearling bucks made up 35 percent of antlered buck harvests in 2017, which is fairly consistent with the previous two years and only slightly higher than the modern (and probably all time) low of 33 percent in 2014. It’s also only about 10 percent lower than the three year average from a decade earlier.
However, it’s a significant decrease from 1989, when yearlings made up 62 percent of the antlered buck kill nationwide, and a darned sight more in some states like Pennsylvania, where it was closer to 97 percent. Meanwhile, the reverse is largely true of older bucks, with those 3 1/2 or older taking up increasingly larger shares.
The top five states in terms of the lowest percentage of yearling bucks were, in descending order:
Florida (17%)
Alabama (14%)
Louisiana (13%)
Mississippi (11%)
Arkansas (7%).
Few folks think of Florida as a big deer hunting state, but they’ve held that #5 spot for three consecutive years, and have been fairly consistent at 17, 19, and 17 percent. Meanwhile, neighboring Alabama’s recent rise could be related to changing their bag limit from one buck a day to three per year and adding mandatory antler restrictions. Louisiana and Mississippi have been frequent flyers in the top 5, based largely on most of their data coming from DMAP or MAR areas. Arkansas, meanwhile, has been a perennial front-runner and a state that’s probably worthy of a little more investigation from nonresident deer hunters.
Over the last decade, it has been largely southeastern states (including Texas) keeping those averages low with the Northeast pulling them up and the Midwest lying comfortably in the middle. That’s not all that surprising given that the QDMA philosophy originated in the Southeast and Texas.
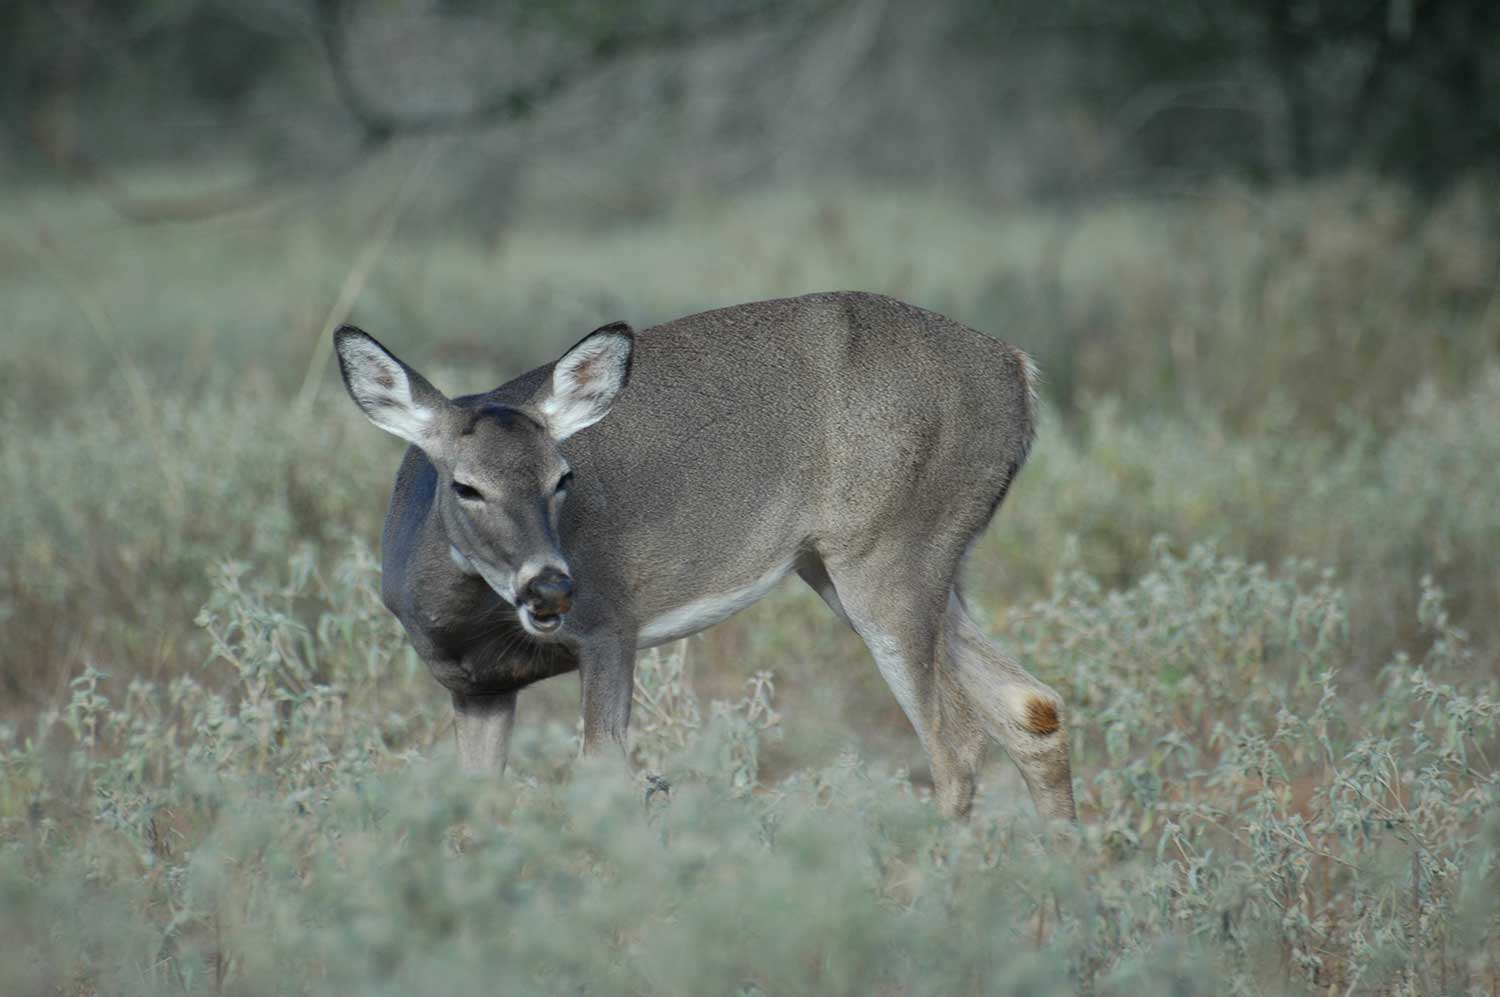
Antlerless harvest is also important as females represent the foundation of virtually every deer management program, and the general trend in most areas has been downward. Doe kills for the top three states have declined by nearly 20 percent since 2007:
Texas (411,200),
Georgia (242,205)
Pennsylvania (203,409)
Nationwide, deer hunters actually killed more bucks than does for the first time since 1998.
Again, reasons vary due to differences in deer density, productivity, and management objectives as well as uncontrollable factors like weather, disease, and predators. Still, the general trends suggest more states are reaching or have met the population objectives that once drove liberal bag limits and aggressive antlerless harvests to balance populations with available habitat–another leg of the QDMA stool.
Guns, Bows, or Muzzleloaders?
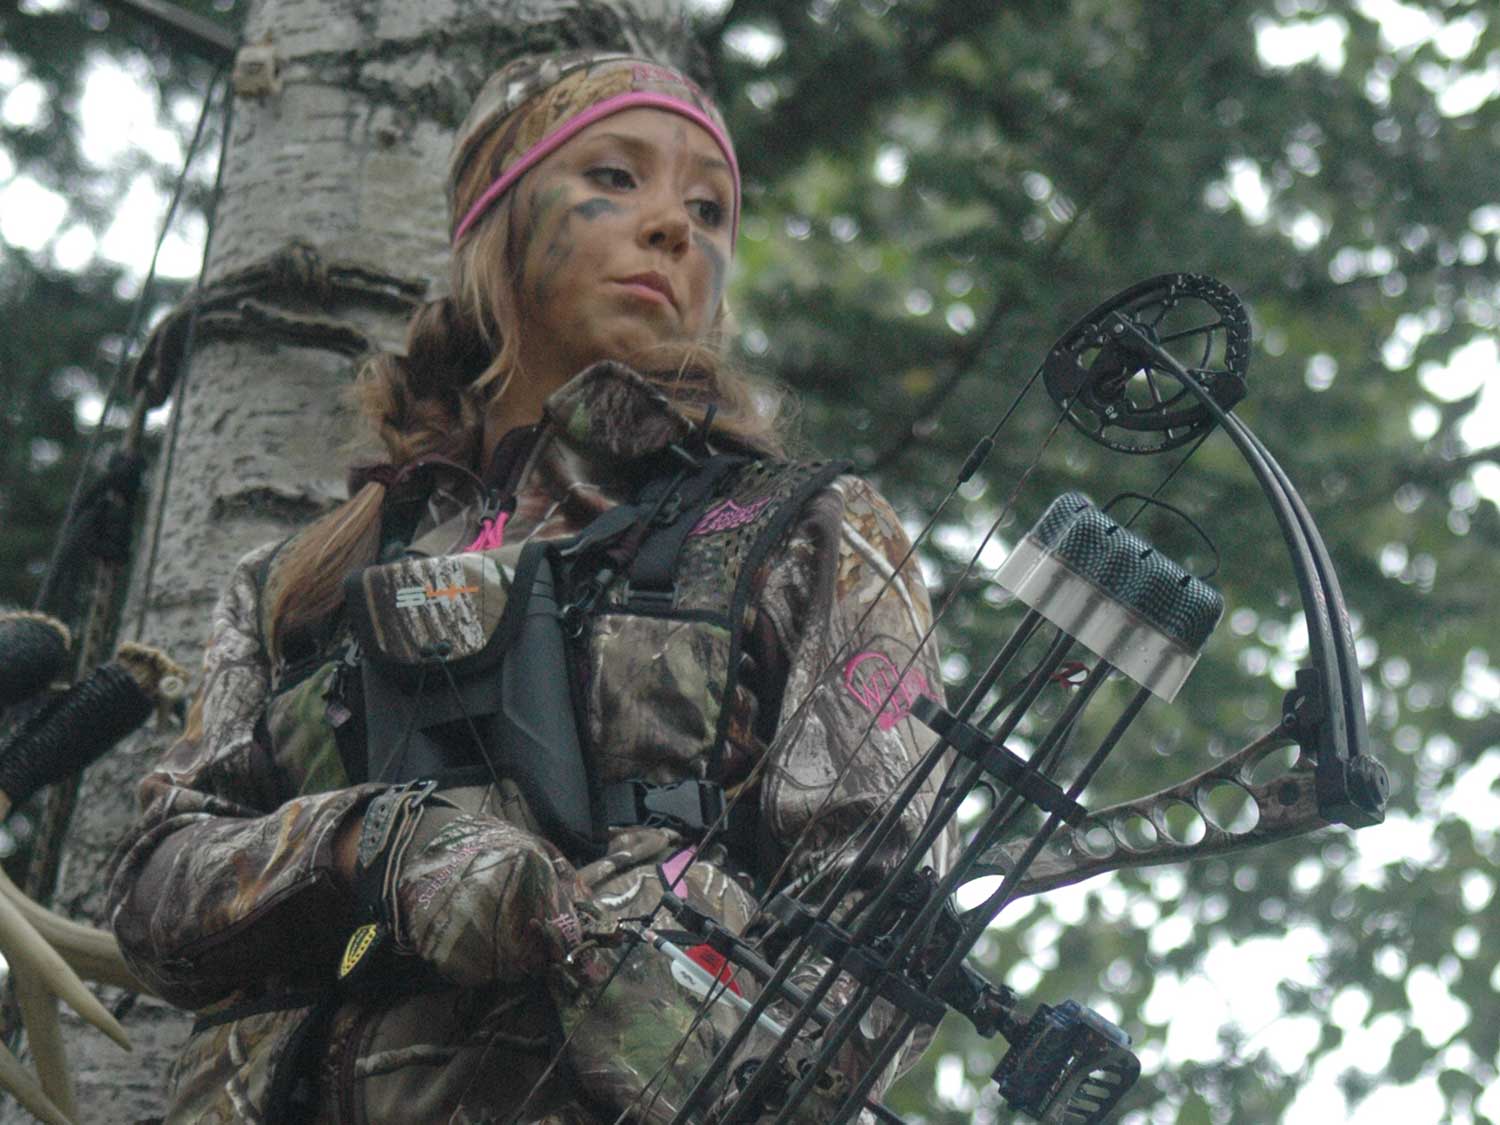
Firearms hunters account for roughly 66 percent of the kill, followed by archers at 23 percent, muzzleloaders (which are also firearms) at 10 percent, and “other” killing only one percent. Bowhunting seems to show the most growth, with their portion of the overall kill rising from 15 to 23 percent since 2002. The five top states for percentage of overall deer kill taken by archers (including crossbows) are:
New Jersey (58%)
Massachusetts (43%)
Ohio (43%)
Illinois (39%)
Kansas (37%)
That interesting mix represents both densely-developed states in the Northeast, where gun hunting may be impractical or limited, more rural states with longer, more liberal bow seasons, and Ohio, which has a good mix of both. The Midwest also has the most bowhunters, but the Northeast is the leader in terms of bowhunters per square mile.
Alternate Mortality
Hunters aren’t the only thing impacting deer populations. Average fawn recruitment rates declined significantly from 2000 to 2005, dropped again from 2005 to 2010, then remained similar from 2010 to 2017. The Report didn’t elaborate, but recent research throughout the southeast shows that coyotes are having a growing negative effect on recruitment rate.
Though it still lingers, deer herds have survived the last big EHD outbreak that caused some severe, localized die-offs. CWD seems to be a far greater and increasing threat, and recent research showing yearling buck dispersal as a possible mechanism for spreading it has raised concern over protecting this segment of the population. QDMA suggests an equal focus on antlerless deer to keep herds balanced with habitat.
Read Next: 10 Deer Facts Hunters Got Completely Wrong
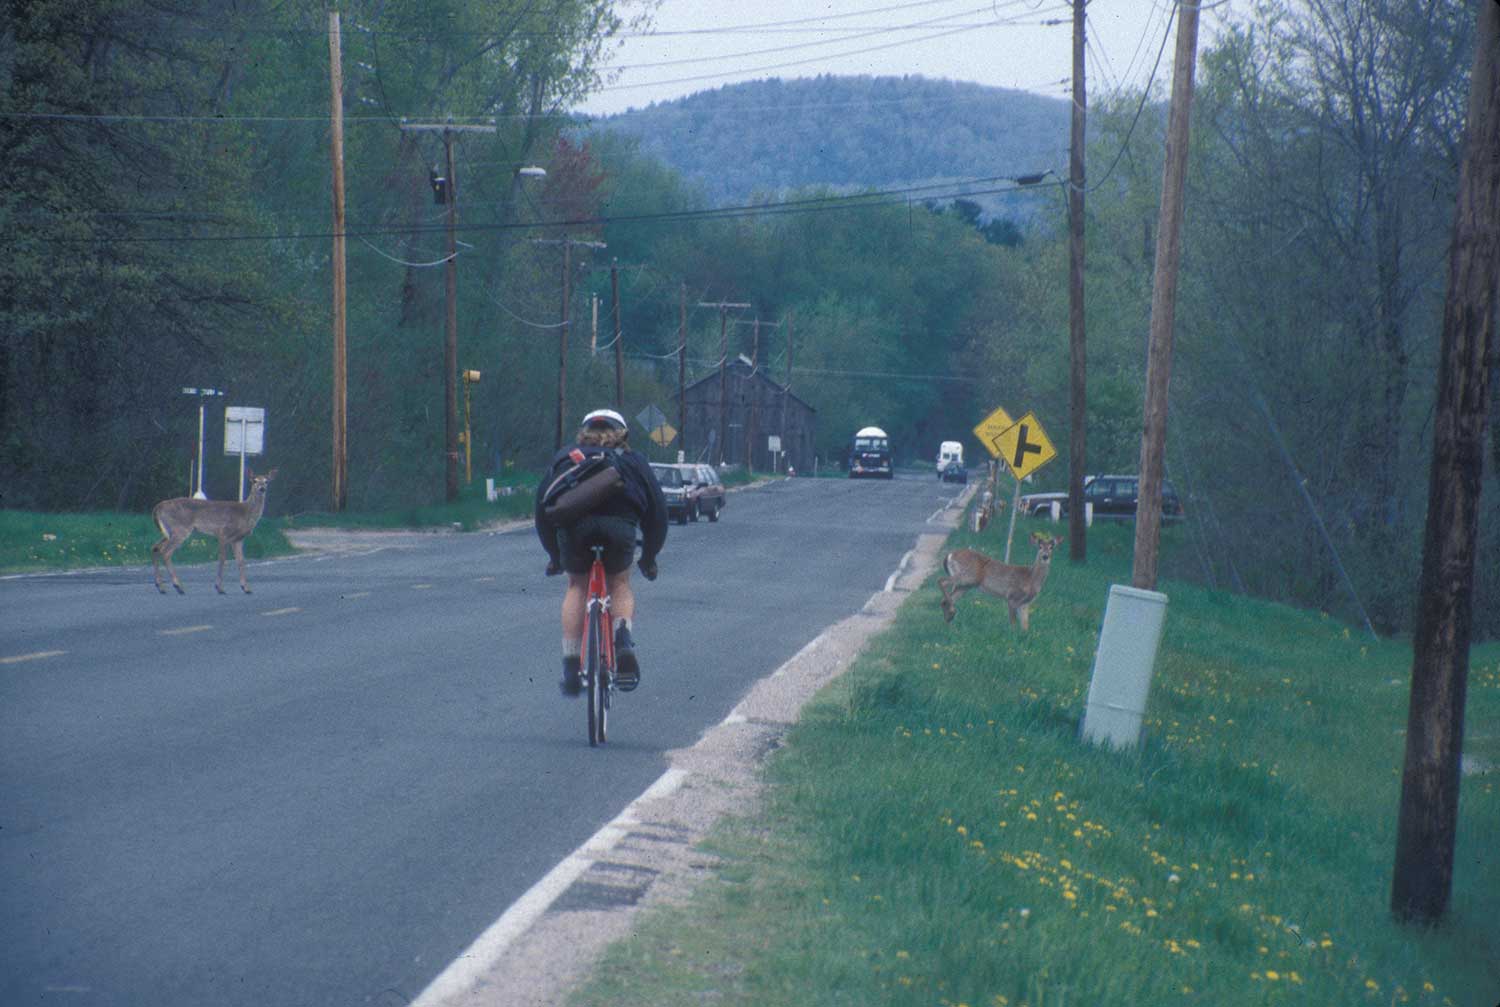
Deer-Vehicle Accidents
Unless you’ve recently been involved in one, you probably don’t think much about deer-vehicle accidents (DVAs). QDMA thinks about them a lot, and they compared three periods 2002-03, 2011-12, and 2017-18 to illustrate expected trends.
In general, DVAs went up in all regions, with the southeast seeing the most dramatic increase (72 percent). On a local level, Pennsylvania led the nation and results for DVAs per road mile were about as expected.
Top States With Deer-Vehicle Accidents, 2017-18
Pennsylvania 141,777
Michigan 87,959
New York 72,314
North Carolina 64,200
Texas 60,857
Top States With Deer-Vehicle Accidents per Road Mile
Pennsylvania 0.57
Maryland 0.43
Delaware 0.39
Virginia 0.37
Michigan 0.34
The Report also compared DVAs and harvest, anticipating the former would be a small percentage of the latter. In 2017-18, the southeast DVA total was 14 percent of the 2017 deer harvest; or one deer hit for every eight taken by hunters.
“This seems high, but it is far worse in the Midwest (22 percent), Northeast (36 percent), and West (39 percent),” The 2019 Whitetail Report suggests. “Motorists in the Northeast and West hit nearly four deer for every ten taken by hunters, and nationally the three worst offenders were Connecticut (87 percent), California, and Massachusetts (81 percent)!”
If you’ve driven in any of these places you can probably understand why. This represents a wasted resource and a personal safety risk. The Report concluded that “It would be far better to take more deer during the (hunting) season and fewer on our roads.”
For more information and to download the entire 2019 report, please visit: https://www.qdma.com/about/whitetail-reports/